Introducing the visualization view
Learn about the latest way to look at data in RemotiveCloud - the visualization view. This is the perfect place to start if you want to get a comprehensive overview of the drive cycle or if you are looking for a particular signal.
Introducing the visualization view
Learn about the latest way to look at data in RemotiveCloud - the visualization view. This is the perfect place to start if you want to get a comprehensive overview of the drive cycle or if you are looking for a particular signal.
Share specific scenarios & explore the full data set
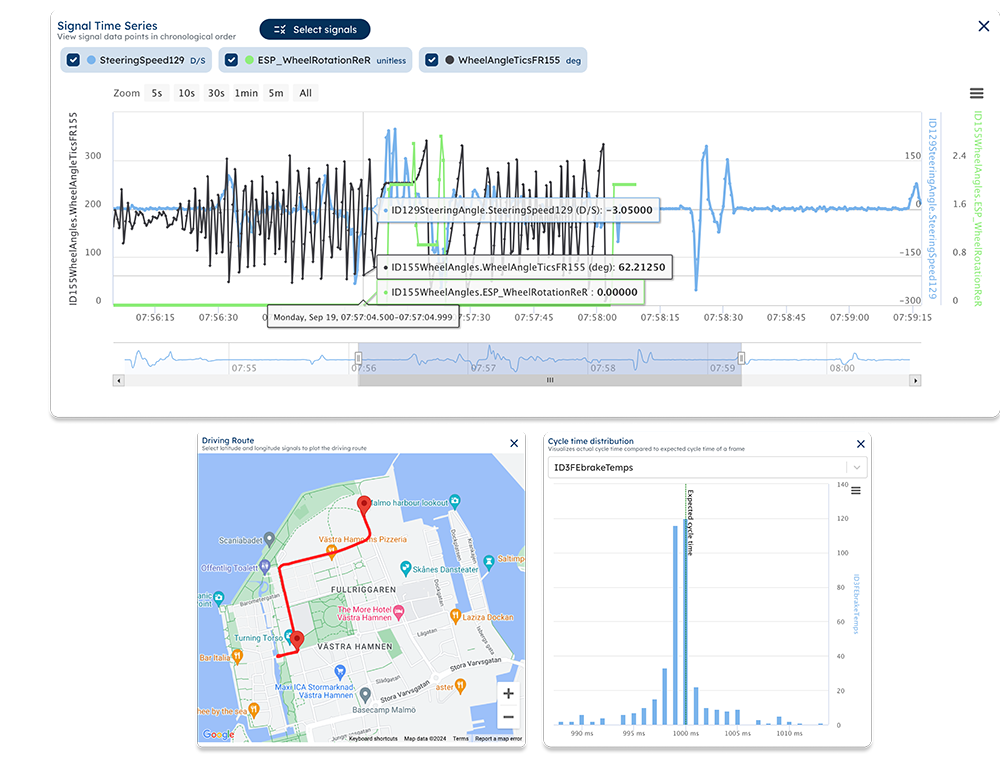
The visualization view is a new feature in RemotiveCloud that allows you to visualize all signal data in a recording with graphs and maps, providing an overview of the full drive cycle. Use signal time series to select signals of interest, share the view with coworkers, and add a map to provide context. View the actual cycle time distribution and compare it to the expected cycle time of a frame to find anomalies.
Get an overview of the visualization view on the RemotiveCloud product page - or request access to the closed beta directly in RemotiveCloud, by navigating to the new Visualize tab in your recording session.
How to get-stuff-done with the visualization view
There are different scenarios in which the visualization feature can be useful, both on its own and in combination with other parts of the RemotiveLabs platform. See below two use cases:
- Use case 1: Co-debug / share scenarios
Example of challenge: You have identified a scenario where the behavior of a signal is off, and you want to share it with a coworker. - Use case 2: Identify / work with specific signals
Example of challenge: You need to identify a proprietary signal for an infotainment application and transform it into VSS.
Use case 1: Co-debug / share scenarios
Challenge: You have discovered a scenario that you want to discuss with a coworker, but you do not have any means to share a dynamic view of the scenario.
Solution: Use RemotiveCloud and the visualization view to co-debug by viewing the same signals (prerequisites: Create an account and a project in RemotiveCloud, invite your coworkers and upload your recording).
Step 1. Use RemotiveCloud and the visualize view to explore the drive cycle. Select signals of interest and zoom / pan to look for possible anomalies.
Step 2. When you have found a specific scenario of interest, use the share functionality to share those exact signals with your coworkers.
Step 3. Continue the investigation with your coworkers - using a single point of truth!
Use case 2: Identify / work with specific signals
Challenge: You need to identify a proprietary signal for an infotainment application and transform it into VSS. In this case we want to stream a VSS signal for average battery consumption into a Protopie infotainment cluster prototype.
Solution: Combine RemotiveLabs' tooling suite for an efficient process (prerequisites: Create an account and a project in RemotiveCloud, and upload your recording and signal database).
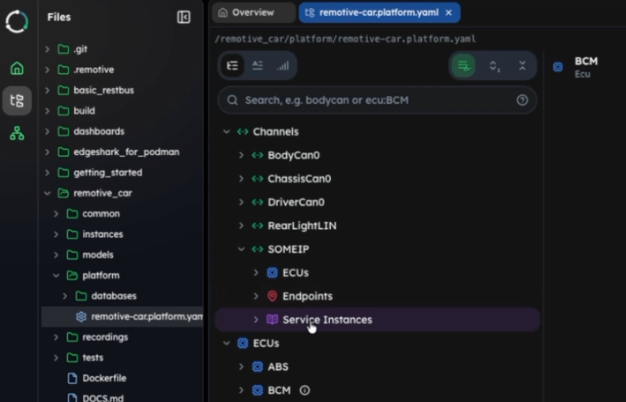
Step 1: Go to the visualize tab in the recording and view the full dataset. Search for the signal you are looking for by name, ID, or unit.
Step 2: If the desired signal doesn't exist in the proprietary data, open RemotiveCLI and use LUA scripting to combine signals into VSS. Read the documentation about scripted signals and view a detailed demo on how to iterate VSS in this webinar.
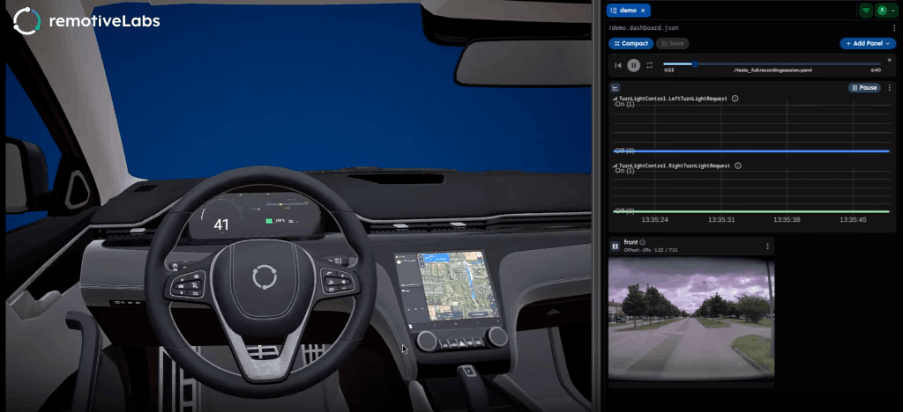
Step 3: Use the RemotiveCLI to set up and feed your recording with the transformed VSS signals into Protopie (refer to the how-to guide or view this webinar). Invite coworkers to the same project, allowing them to access the same curated data set.
Check out the latest from us


Join the automotive rebels that #getstuffdone with RemotiveLabs!